FortiGate IPsec VPN Tunnel: 7 Powerful Troubleshooting Tips
Description
Learn how to troubleshoot FortiGate IPsec VPN tunnels using identification, Phase 1 and Phase 2 checks, debugging commands, and diagnostic methods.
Scope
This article is intended for FortiGate administrators, network engineers, and IT professionals who need to identify, debug, and troubleshoot FortiGate IPsec VPN tunnel issues.
This guide covers troubleshooting techniques for FortiGate IPsec VPN tunnels on:
- FortiGate v7.2 and above
Solution
1. Identification
The first step in troubleshooting a FortiGate IPsec VPN Tunnel is to check the reachability of the destination according to the routing table.
Run the following command from the VDOM:
get router info routing-table detail
If the destination is reachable through multiple tunnels, isolate the problematic tunnel.
Enter the VDOM (if applicable) where the VPN is configured and run.
get vpn ipsec tunnel summary
Example output:
					'to10.174.0.182' 10.174.0.182:0  selectors(total,up): 1/1  rx(pkt,err): 1921/0  tx(pkt,err): 69/2
'to10.189.0.182' 10.189.0.182:0  selectors(total,up): 1/0  rx(pkt,err): 0/0  tx(pkt,err): 0/0
In this output, two VPN tunnels are visible:
					to10.174.0.182
to10.189.0.182
The second VPN tunnel has its selectors in a down state. Therefore, troubleshooting will focus on this tunnel.
2. Phase 1 Checks
After identifying the problematic tunnel, check the Phase 1 status.
Run the following command:
diagnose vpn ike gateway list name EX: to10.189.0.182
Example output:
					vd: root/0
name: to10.189.0.182
version: 1
interface: port9 10
addr: 10.189.0.31:500 -> 10.189.0.182:500
created: 15s ago
IKE SA: created 1/1
IPsec SA: created 0/0
id/spi: 19576 a83334b3c66f871b/0000000000000000
direction: responder
status: connecting, state 3, started 15s ago
The key field to check in this command is:
status
This field shows the current state of the VPN connection and usually displays one of the following:
Established
This indicates that Phase 1 of the FortiGate IPsec VPN tunnel is active.
In this situation, verify the Phase 2 configuration and related parameters.
Connecting
This indicates that Phase 1 of the FortiGate IPsec VPN Tunnel has not been successfully established.
If Phase 1 is down, additional checks are required to identify the cause.
3. Connectivity Checks Between VPN Gateways
Ensure bidirectional connectivity for the FortiGate IPsec VPN Tunnel between the VPN gateways. Usually, this is the IP address configured on the WAN interface. Try to traceroute or ping toward the VPN peer.
In this example, use:
execute traceroute-options source 10.189.0.31
execute traceroute 10.189.0.182
Confirm that IKE traffic using port 500 or 4500 is not blocked somewhere along the path.
To check this, perform a packet capture using the sniffer command:
diagnose sniffer packet any "host 10.189.0.182 and (port 500 or port 4500)" 4 0 l
Output:
					interfaces=[any]
filters=[host 10.189.0.182 and (port 500 or port 4500)]
Note
If NAT traversal is enabled under Phase 1 and FortiGate is behind NAT, sniff traffic using:
udp port 4500
Otherwise, use:
udp port 500
4. IKE Debugging
If both previous checks are successful, start IKE debugging to troubleshoot the FortiGate IPsec VPN Tunnel and check for possible configuration mismatches between VPN peers.
Run:
					diagnose debug reset
diagnose vpn ike log filter dst-addr4 10.189.0.182
diagnose debug application ike -1
diagnose debug console timestamp enable
diagnose debug enable
To stop debugging, use:
					diagnose debug disable
diagnose debug reset
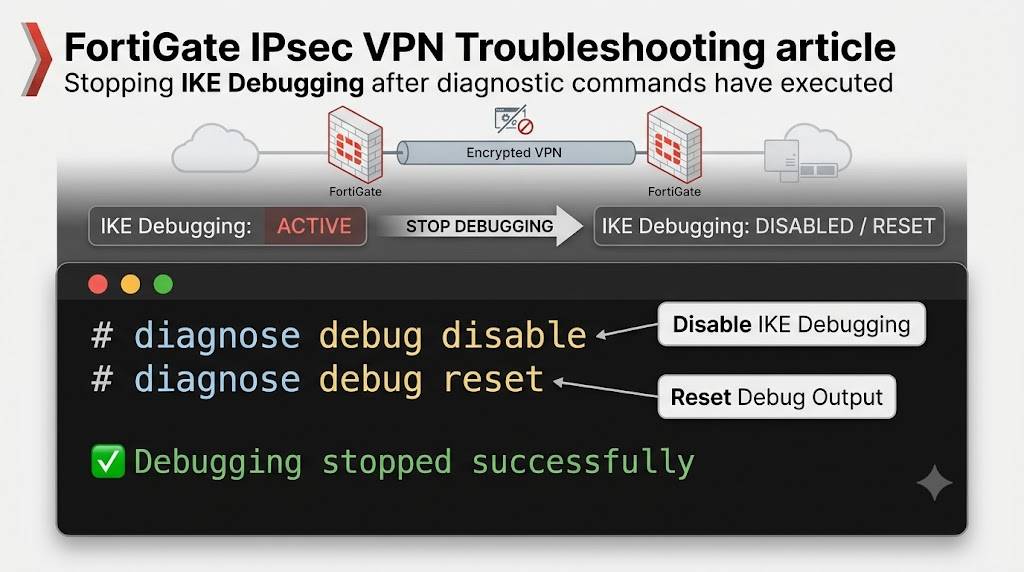
In FortiOS v7.6.3, IKE debugging can be performed through the GUI using the CLI diagnostics command.
Other IKE Filter Options
					rem-addr4   <----- IPv4 remote gateway address range to filter by.
msrc-addr4    <----- Multiple IPv4 source addresses to filter by.
mdst-addr4    <----- Multiple IPv4 destination addresses to filter by.
msrc-addr6    <----- Multiple IPv6 source address to filter by.
mdst-addr6    <----- Multiple IPv6 destination addresses to filter by.
For FortiOS v7.4.0 and above, the command changes slightly:
					diagnose debug reset
diagnose vpn ike log filter rem-addr4 10.189.0.182
diagnose debug application ike -1
diagnose debug console timestamp enable
diagnose debug enable
After collecting debugging output, disable debugging:
					diagnose debug disable
diagnose debug reset
5. Phase 2 Checks
If the status of Phase 1 is Established, focus on Phase 2.
Run the following command:
diagnose vpn tunnel list name
Example:
diagnose vpn tunnel list name to10.189.0.182
Output:
					list all ipsec tunnel in vd 0
name=to10.189.0.182 ver=1 serial=2 10.189.0.31:0->10.189.0.182:0
bound_if=10 lgwy=static/1 tun=intf/0 mode=auto/1 encap=none/8 options[0008]=npu
proxyid_num=1 child_num=0 refcnt=10 ilast=25 olast=25 ad=/0
stat: rxp=0 txp=0 rxb=0 txb=0
dpd: mode=on-demand on=0 idle=20000ms retry=3 count=0 seqno=534
natt: mode=none draft=0 interval=0 remote_port=0
proxyid=to10.189.0.182 proto=0 sa=0 ref=1 serial=4
src: 0:172.16.170.0/255.255.255.0:0
dst: 0:192.168.50.0/255.255.255.0:0
The important field in this output is:
sa
The SA field can have three values:
- sa=0 indicates there is a mismatch between selectors or no traffic is being initiated.
- sa=1 indicates IPsec SA is matching and there is traffic between the selectors.
- sa=2 is only visible during IPsec SA rekey.
In some cases, Phase 2 encryption and hashing algorithms may be mismatched.
The selectors can be viewed using:
get vpn ipsec tunnel details
To identify this type of error, run IKE debugging as described earlier.
Dial-Up Tunnel Check
When using a dial-up tunnel, run the following command to view all connection instances of Phase 1:
diagnose vpn tunnel dialup-list
Note
If packet captures are required, it is recommended to first run:
diagnose debug console time enable
This ensures that debug message timestamps align with packet sniffer timestamps, allowing accurate correlation of events and timing.
Note
Starting from v7.4.1, the command:
diagnose vpn ike log-filter src-addr4
has been changed to:
diagnose vpn ike log filter loc-addr4
6. IPsec Troubleshooting Scenario
A troubleshooting scenario was performed for the FortiGate IPsec VPN Tunnel, where the following debugs were collected, but no relevant information was found for the tunnel shown as inactive.
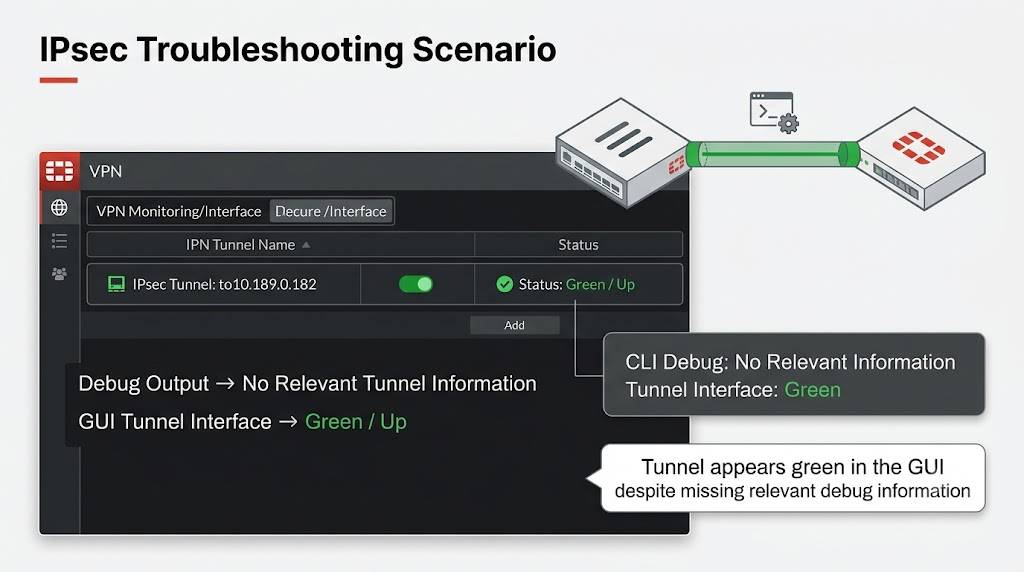
In the GUI, the tunnel interface appears green.
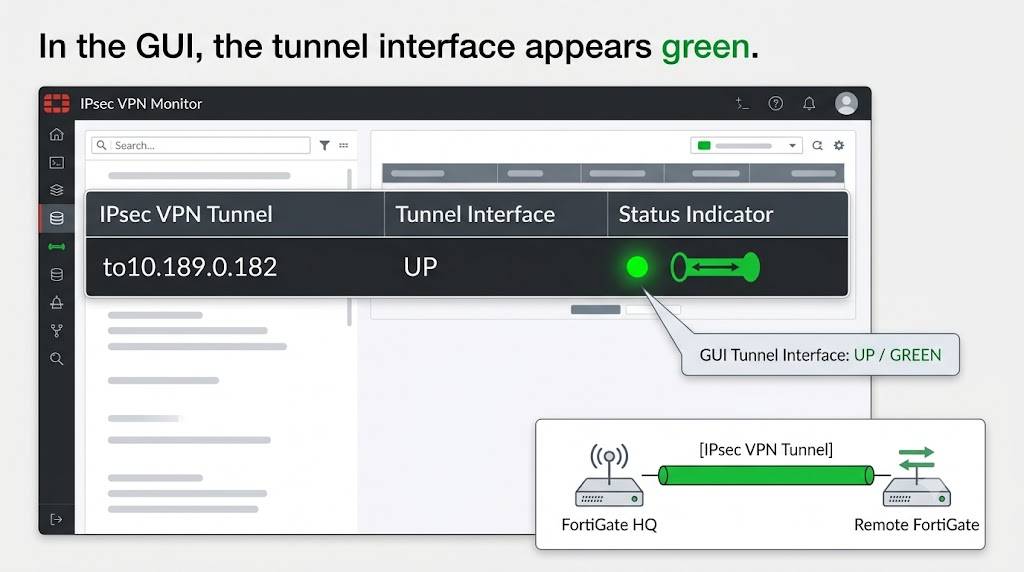
The tunnel is inactive, and the sniffer output shows that traffic is not passing through the tunnel.
Example:
FortiGate-61F # diagnose sniffer packet any 'host 10.1.1.37 and icmp' 4 0 l
Output:
					interfaces=[any]
filters=[host 10.1.1.37 and icmp]
2024-07-16 10:46:01.327162 internal in 192.168.1.251 -> 10.1.1.37: icmp: echo request
2024-07-16 10:46:02.331446 internal in 192.168.1.251 -> 10.1.1.37: icmp: echo request
2024-07-16 10:46:03.335546 internal in 192.168.1.251 -> 10.1.1.37: icmp: echo request
Debug flow does not show any drops and ends at the last line before repeating:
					2024-07-16 10:47:54 id=20085 trace_id=4 func=iprope_dnat_check line=5191 msg="in-[internal], out-[]"
2024-07-16 10:47:54 id=20085 trace_id=4 func=iprope_dnat_check line=5204 msg="result: skb_flags-02000000, vid-0, ret-no-match, act-accept, flag-00000000"
2024-07-16 10:47:54 id=20085 trace_id=4 func=vf_ip_route_input_common line=2615 msg="find a route: flag=00000000 gw-10.1.1.37 via root"
2024-07-16 10:47:59 id=20085 trace_id=5 func=print_pkt_detail line=5746 msg="vd-root:0 received a packet(proto=1, 192.168.1.251:1->10.1.1.37:2048) from internal. type=8, code=0, id=1, seq=288."
Verify Encryption Negotiation
The encryption status can be checked using:
diagnose vpn tunnel list name Primary Tunnel
Output:
					name=Primary Tunnel ver=1 serial=2 10.101.1.1:0->10.101.1.2:0 tun_id=10.101.1.2 dst_mtu=1500 dpd-link=on remote_location=0.0.0.0 weight=1
bound_if=5 lgwy=static/1 tun=intf/0 mode=auto/1 encap=none/520 options[0208]=npu frag-rfc  run_state=0 accept_traffic=1 overlay_id=0
proxyid_num=1 child_num=0 refcnt=4 ilast=0 olast=0 ad=/0
stat: rxp=11746 txp=32 rxb=1939048 txb=9861
dpd: mode=on-demand on=1 idle=10000ms retry=3 count=0 seqno=0
natt: mode=none draft=0 interval=0 remote_port=0
proxyid=Net-10.1.1.0-24 proto=0 sa=1 ref=2 serial=5
src: 0:192.168.1.0/255.255.255.0:0
dst: 0:10.1.1.0/255.255.255.0:0
The output from the command provides details about the IPsec VPN tunnel.
Key information includes:
Tunnel Identification
- Source IP: 10.101.1.1
- Destination IP: 10.101.1.2
- Tunnel ID: 10.101.1.2
- Bound Interface: 5
- Mode: Auto
- Encapsulation: None
Tunnel Options
Options include:
- NPU
- Fragment RFC
Run state is 0, indicating the tunnel is not actively passing traffic.
Traffic Statistics
- Received Packets: 11746
- Transmitted Packets: 32
- Received Bytes: 1939048
- Transmitted Bytes: 9861
Dead Peer Detection (DPD)
- Mode: On-demand
- Idle Time: 10000ms
- Retry Count: 3
NAT Traversal
- Mode: None
Proxy ID and Traffic Selectors
- Proxy ID: Net-10.1.1.0-24
- Source: 192.168.1.0/24
- Destination: 10.1.1.0/24
Security Association (SA)
- MTU: 1438
- Expiry: 42832 seconds
- Replay Window: 2048
Encryption and Authentication
- ESP: AES with a 16-byte key
- AH: SHA1 with a 20-byte key
Packet Statistics
- Decrypted Packets/Bytes: 476/75272
- Encrypted Packets/Bytes: 0
A quick way to verify two-way traffic is to check the enc and dec counters.
If the enc counters increase while the dec counters remain unchanged, traffic is being sent out but not received from the remote side.
Link Monitor Check
It is also necessary to check the Link Monitor settings for a health check.
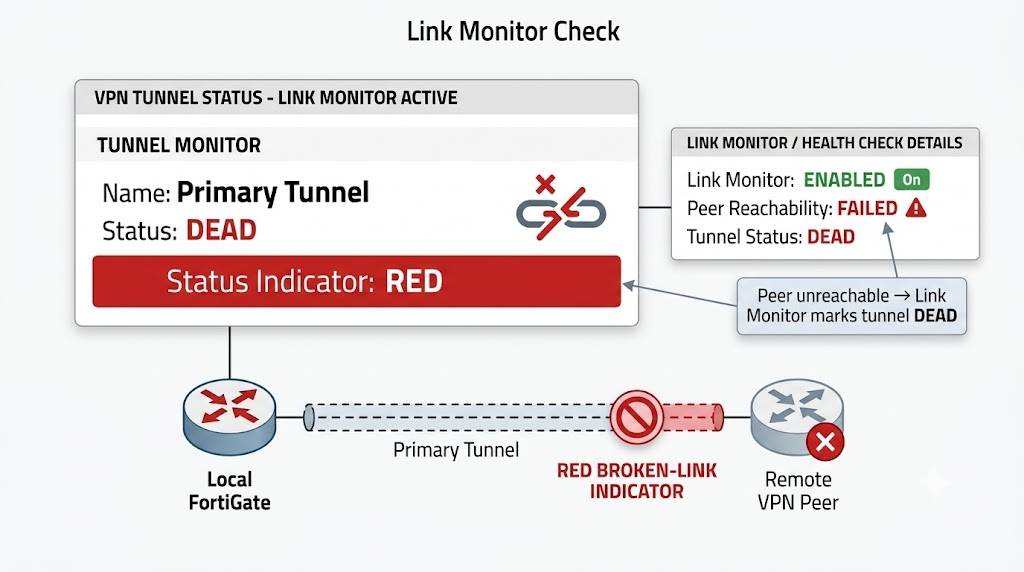
In the above screenshot, the tunnel interface (Primary Tunnel) shows the status dead because the peer is not reachable.
After disabling the settings in the Link Monitor, the tunnel interface becomes active.
Note: NPU Offloading During Troubleshooting
Ensure that NPU offloading is disabled on the FortiGate IPsec VPN tunnel during troubleshooting.
The NPU-offload option is enabled by default. When active, packets may be processed by the NPU, which can prevent capturing hits for flow filters.
Disabling the npu-offload option will reset the IPsec tunnel.
To check whether the npu-offload option is enabled or disabled, use the following command:
					config vpn ipsec phase1-interface
edit <name of the tunnel>
show full | grep npu
Disable NPU Offloading
Use the following commands to disable NPU offloading:
					config vpn ipsec phase1-interface
edit <name of the tunnel>
set npu-offload disable
next
end
7. Additional Diagnostic Commands
The following command can be helpful when presenting output to TAC:
diagnose vpn ike status detailed
Flush the Tunnel
To flush the tunnel, use:
diagnose vpn tunnel flush
diagnose vpn ike gateway clear name
diagnose vpn ike gateway flush name
Unknown SPI Messages
If unknown SPI messages are observed in the event log, it indicates that the FortiGate IPsec VPN tunnel received ESP packets whose SPIs do not match any active IPsec tunnel.
This can happen due to:
- SA rekey mismatches
- FortiGate reboots
- Network disruptions
To resolve this issue, run:
diagnose vpn tunnel flush name <tunnel_name>
This forces the tunnel to renegotiate and synchronize SPIs.
Flushing the FortiGate IPsec VPN tunnel will interrupt VPN traffic. Ensure Phase 2 SA lifetimes match and Dead Peer Detection is enabled to prevent recurrence.
Notes
IKE Filter Command Change
Starting from v7.4.1, the command:
diagnose vpn ike log-filter dst-addr4
has been changed to:
diagnose vpn ike log filter rem-addr4
To filter multiple IPv4 remote gateway addresses, use:
diagnose vpn ike log filter mrem-addr4
To find the available options after:
diagnose vpn ike log filter ?
use a question mark after the command.
Filtering by name is helpful when the remote peer IP address is unknown.
Example:
diagnose vpn ike log filter ?
Available options:
					list                   Display the current filter.
clear                  Erase the current filter.
vd                     Index of virtual domain. -1 matches all.
name                   Phase1 name to filter by.
ifindex                Index of the interface that IKE connection is negotiated over.
loc-addr4              IPv4 local gateway address range to filter by.
mloc-addr4             Multiple IPv4 local gateway address to filter by.
rem-addr4              IPv4 remote gateway address range to filter by.
mrem-addr4             Multiple IPv4 remote gateway address to filter by.
loc-addr6              IPv6 local gateway address range to filter by.
mloc-addr6             Multiple IPv6 local gateway address to filter by.
rem-addr6              IPv6 remote gateway address range to filter by.
mrem-addr6             Multiple IPv6 remote gateway addresses to filter by.
dst-port               Destination port range to filter by.
negate                 Negate existing setting of the specified filter parameter.
Example:
					diagnose vpn ike log filter rem-addr4 10.189.0.182
diagnose debug application ike -1
diagnose debug console timestamp enable
diagnose debug enable
Clear IKE Debug Filter
It is best practice to clear the filter before running debugging.
Use:
diagnose vpn ike log filter clear
For FortiOS v7.4.0 and above:
diagnose vpn ike log filter clear
Remote User Authentication Debugging
Use the following diagnostic command to identify remote user authentication issues:
diagnose debug application fnbamd -1
SAML User Authentication Debugging
Use the following commands to identify SAML user authentication issues:
					diagnose debug application samld -1
diagnose debug application eap_proxy -1
To stop debugging:
					diagnose debug disable
diagnose debug reset
FAQ
What is the first step when troubleshooting an IPsec VPN tunnel on FortiGate?
The first step is to check destination reachability according to the routing table using the routing table detail command.
Which command is used to check IPsec VPN tunnel status?
The command below is used to view IPsec VPN tunnel status:
get vpn ipsec tunnel summary
What does the status field show in IKE gateway output?
The status field shows the current state of the VPN connection, such as Established or Connecting.
What does sa=0 indicate in Phase 2 checks?
sa=0 indicates a mismatch between selectors or that no traffic is being initiated.
Why should NPU offloading be disabled during troubleshooting?
NPU processing can prevent capturing hits for flow filters during troubleshooting.