Fix FortiGate IPsec VPN Up but Network Not Reachable 6 Steps
Description
Troubleshoot FortiGate IPsec VPN Up but Network Not Reachable issues with practical checks for routing, policies, Phase 1, Phase 2, and traffic flow now.
Scope
This article is intended for FortiGate administrators and network professionals troubleshooting issues where a FortiGate IPsec VPN is up but the network is not reachable.
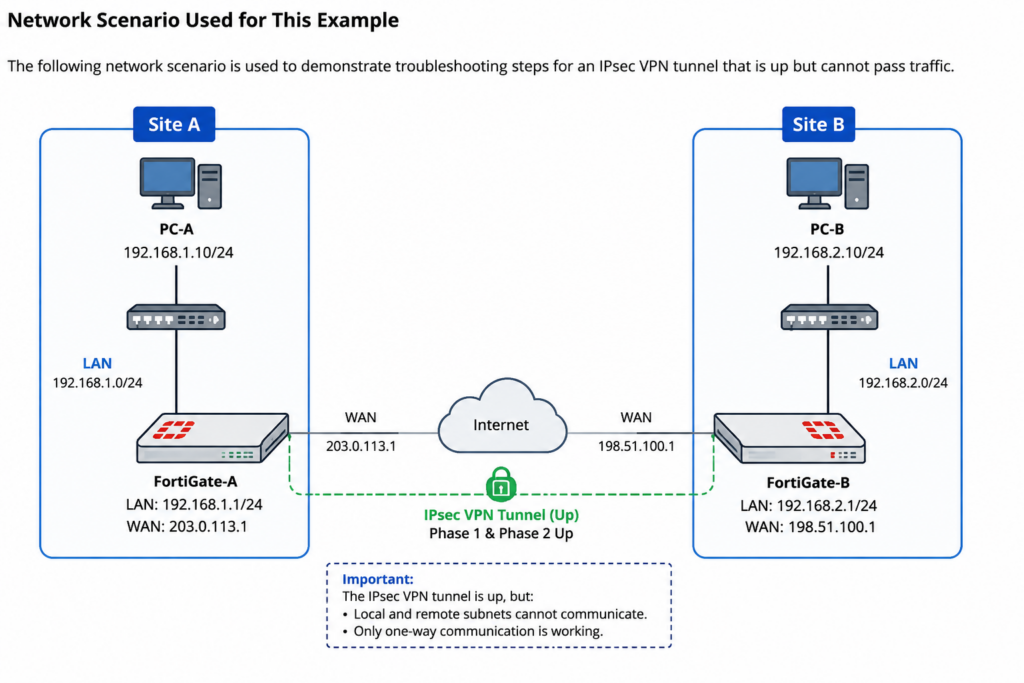
It explains how to troubleshoot situations where:
- The site-to-site IPsec VPN tunnel between two FortiGates is up.
- Local and remote subnets cannot communicate.
- Only one-way communication is working.
Platform: FortiGate
Solution
Network Scenario Used for This Example
The following network scenario is used to demonstrate troubleshooting steps for a FortiGate IPsec VPN Up but Network Not Reachable scenario where the IPsec VPN tunnel is up but cannot pass traffic.
Troubleshooting Steps
Below are the steps to identify and resolve the issue.
1. Check Phase 2 Selector
First, verify that the required source and destination IP addresses are configured in the Phase 2 selector on both FortiGate units when troubleshooting a FortiGate IPsec VPN Up but Network Not Reachable issue.
Also confirm that the Phase 2 selector status is up.
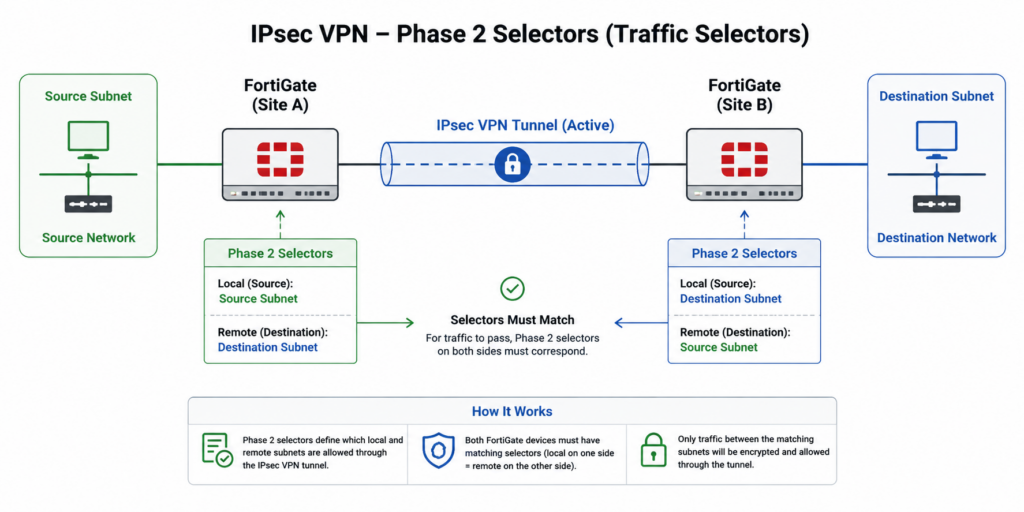
Use the following command:
diagnose vpn tunnel list
Command Explanation:
This command displays detailed information about IPsec VPN tunnels, including:
- Tunnel status
- Phase 2 selectors
- Security Association (SA) status
- Source and destination selector
Example:
					FortigateA# diagnose vpn tunnel list
## list all ipsec tunnel in vd 0
name=vpn ver=1 serial=2 10.40.19.195:0->10.5.25.62:0
bound_if=3 lgwy=static/1 tun=intf/0 mode=auto/1 encap=none/0
proxyid_num=2 child_num=0 refcnt=12 ilast=7 olast=568 ad=/0
stat: rxp=0 txp=0 rxb=0 txb=0
dpd: mode=on-demand on=1 idle=20000ms retry=3 count=0 seqno=0
natt: mode=none draft=0 interval=0 remote_port=0
proxyid=vpna proto=0 sa=1 ref=2 serial=3
src: 0:172.16.0.0/255.255.255.0:0
dst: 0:192.168.1.0/255.255.255.0:0
SA:  ref=3 options=10226 type=00 soft=0 mtu=1280 expire=42402/0B replaywin=2048
seqno=1 esn=0 replaywin_lastseq=00000000 itn=0
life: type=01 bytes=0/0 timeout=42930/43200
dec: spi=a9a85865 esp=aes key=16 e25c71269c3f44205d1074d3ee5e6b36
ah=sha1 key=20 f5cf85d6c2b2a20918f83e92e1c18d9450ab4415
enc: spi=687f405e esp=aes key=16 3a0730ac611aaf84eea0438d127ec652
ah=sha1 key=20 4f6f509be0cd6a27588b4c4b1b0dec086a638913
dec\:pkts/bytes=0/0, enc\:pkts/bytes=0/0
Important Field:
sa=1
The value SA=1 means the Phase 2 selector (proxyid) is up.
The output shows:
proxyid=vpna proto=0 sa=1
This confirms that the Phase 2 selector named vpna is active.
Check Multiple Phase 2 Selectors
If multiple Phase 2 selectors are configured, use:
diagnose vpn tunnel list | grep -f "proxyid="
Command Explanation:
This command filters the VPN tunnel output and displays only the lines containing proxyid information, which can help troubleshoot a FortiGate IPsec VPN Up but Network Not Reachable issue.
It helps quickly identify the status of multiple Phase 2 selectors.
Example:
					diagnose vpn tunnel list | grep -f "proxyid=vpna"
proxyid=vpna proto=0 sa=1 ref=2 serial=3
The output confirms that the Phase 2 selector vpna is active.
2. Verify Routing Table
Both FortiGate devices must have an active route to the remote subnet.
FortiGate A
Command:
get router info routing-table details 192.168.1.0
Command Explanation:
This command checks the routing table entry for the remote network 192.168.1.0.
Example output:
					Routing table for VRF=0
Routing entry for 192.168.1.0/24
Known via "static", distance 10, metric 0, best
- directly connected, vpna
The output confirms that the remote subnet is reachable through the VPN interface vpna.
FortiGate B
Command:
get router info routing-table details 172.16.0.0
Command Explanation:
This command checks the routing table entry for the remote network 172.16.0.0.
Example output:
					Routing table for VRF=0
Routing entry for 172.16.0.0/24
Known via "static", distance 10, metric 0, best
* directly connected, vpnb
The output confirms that the remote subnet is reachable through the VPN interface vpnb.
3. Policy Routing Check
If policy routing is applied to a specific source or destination, create a policy route for the respective source and destination subnets.
For a FortiGate IPsec VPN Up but Network Not Reachable issue, the interface should be configured as the VPN tunnel, and the policy route should remain on top.
4. Firewall Policies
Verify that both FortiGate devices have:
- LAN to VPN allow policies
- VPN to LAN allow policies
The policies must contain the correct:
- Source addresses
- Destination addresses
- Services
Note
For the LAN to VPN policy:
- Keep NAT disabled.
For the VPN to LAN policy:
- Keep PAT enabled.
5. Firewall Policy Lookup
Use the following command to perform a policy lookup:
diagnose firewall iprope lookup
Command Explanation:
This command checks which firewall policy will match a specific traffic flow.
It helps verify whether traffic from a source network to a destination network is matching the expected firewall policy when troubleshooting a FortiGate IPsec VPN Up but Network Not Reachable issue.
Example
To analyze a ping from:
- Source:
172.16.0.1 - Destination:
192.168.1.1
Use:
diagnose firewall iprope lookup 172.16.0.1 5178 192.168.1.1 443 0 lan
Command Explanation:
This command performs a policy lookup for the specified traffic:
- Source IP:
172.16.0.1 - Source port:
5178 - Destination IP:
192.168.1.1 - Destination port:
443 - Protocol:
0 - Interface:
lan
Example output:
<src [172.16.0.1 -5178] dst [192.168.1.1-443] proto 0 dev lan <----- Matches policy id: 1.
The output confirms that the traffic matches policy ID 1.
Protocol IDs
The protocol ID values are:
- UDP =
17 - TCP =
6 - Other protocols =
0
6. Collect Debug Output for Further Analysis
If the previous checks do not identify the issue, raise a technical assistance ticket and provide:
- FortiGate device configuration
- Network diagram
- Debug outputs from the commands below
Run the following commands on both FortiGate devices and initiate communication to capture traffic flow.
SSH Session 1: Debug Flow
Run:
					diagnose debug disable
diagnose debub reset
diagnose debug flow filter proto
Command Explanation:
These commands prepare the FortiGate debug environment:
diagnose debug disablestops any running debug process.diagnose debub resetresets previous debug settings.diagnose debug flow filter protofilters debug flow output based on protocol.
Protocol examples:
- Ping =
1 - UDP =
17 - TCP =
6
Continue with:
diagnose debug flow filter addr
Command Explanation:
This command filters traffic debugging based on source and destination addresses.
Example:
diagnose debug flow filter addr 172.16.0.10 192.168.0.12
This filters traffic between:
- Source IP:
172.16.0.10 - Destination IP:
192.168.0.12
Add the following commands:
					diagnose debug flow show function-name enable
diagnose debug flow show iprope enable
diagnose debug flow trace start 1000
diagnose debug enable
Command Explanation:
diagnose debug flow show function-name enable
Displays function names in the debug output.diagnose debug flow show iprope enable
Displays firewall policy lookup information.diagnose debug flow trace start 1000
Starts packet flow tracing for 1000 packets.diagnose debug enable
Enables the debug output.
SSH Session 2: Packet Capture
Run:
diagnose sniffer packet any "host y.y.y.y" 6 0 l
Command Explanation:
This command captures packets passing through FortiGate.
It helps verify whether traffic is reaching FortiGate and passing through the VPN tunnel.
Offloading During Troubleshooting
Temporarily disable offloading on:
- Firewall policy
- IPsec Phase 1
This ensures that all traffic is captured during troubleshooting.
Related reference:
Technical Tip: Useful filters for sniffer packet capture
Check Destination Windows PC
In some cases, the root cause may be related to the Windows PC receiving the traffic.
As an initial troubleshooting step:
- Temporarily disable Windows Defender on the destination PC.
The destination PC may respond to ping requests from the same Internet network but fail to respond to machines located on the opposite side of the VPN tunnel, which can occur in a FortiGate IPsec VPN Up but Network Not Reachable scenario.
A possible reason is antivirus software installed on the destination PC.
Enable NAT from Tunnel to Internal Network
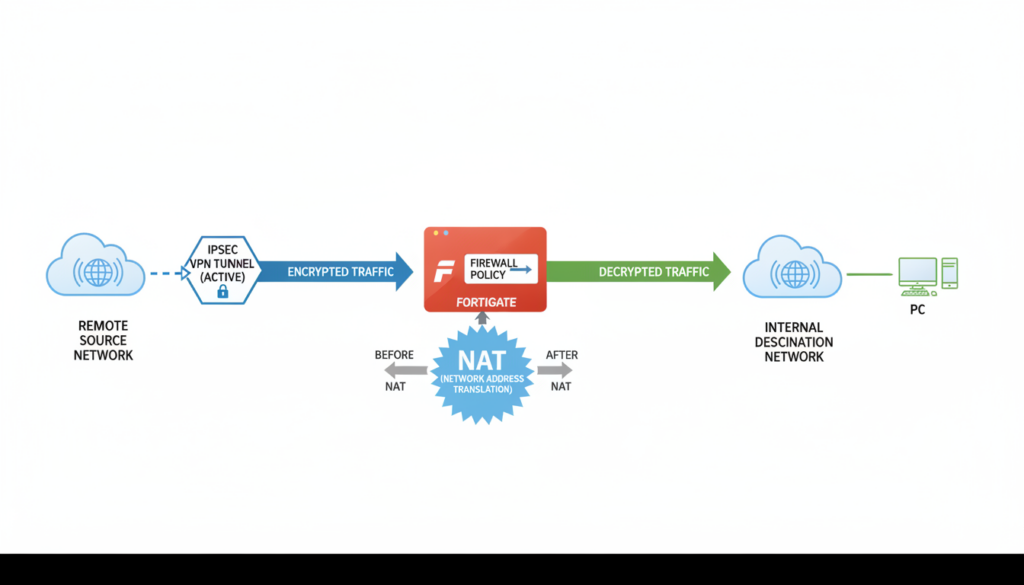
To resolve this FortiGate IPsec VPN Up but Network Not Reachable issue, enable Network Address Translation (NAT) in the firewall policy from the tunnel to the internal network.
FAQ
Why is IPsec VPN traffic not working even when the tunnel is up?
The issue can occur due to Phase 2 selector problems, missing routes, firewall policies, policy routing, or traffic filtering.
Which command checks Phase 2 selector status?
Use:
diagnose vpn tunnel list
This command displays tunnel and Phase 2 selector information.
What does SA=1 mean in the IPsec tunnel output?
SA=1 means the Phase 2 selector (proxyid) is up.
Which command checks the route to a remote subnet?
Use:
get router info routing-table details
It verifies whether FortiGate has an active route to the remote network.
Which command checks the matching firewall policy?
Use:
diagnose firewall iprope lookup
It identifies the firewall policy matching the traffic.