Verifying FortiGuard Connectivity In FortiManager

Verifying FortiGuard Connectivity In FortiManager

Description

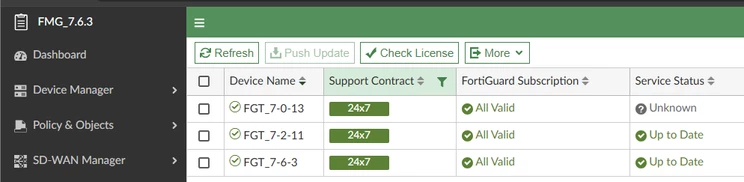
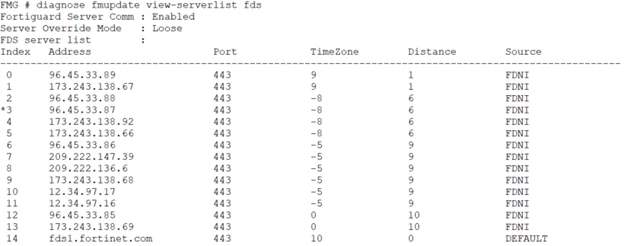
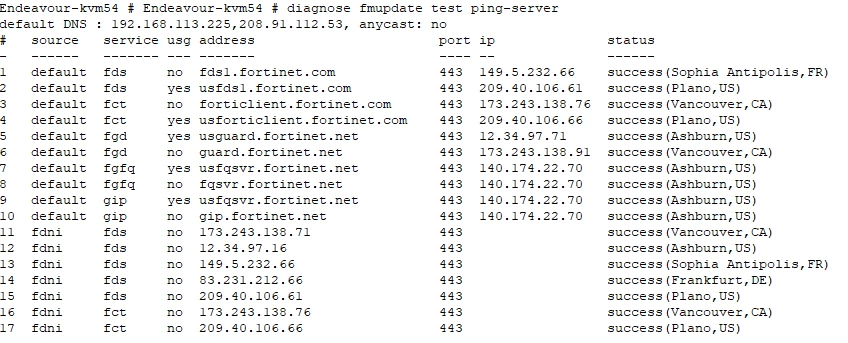
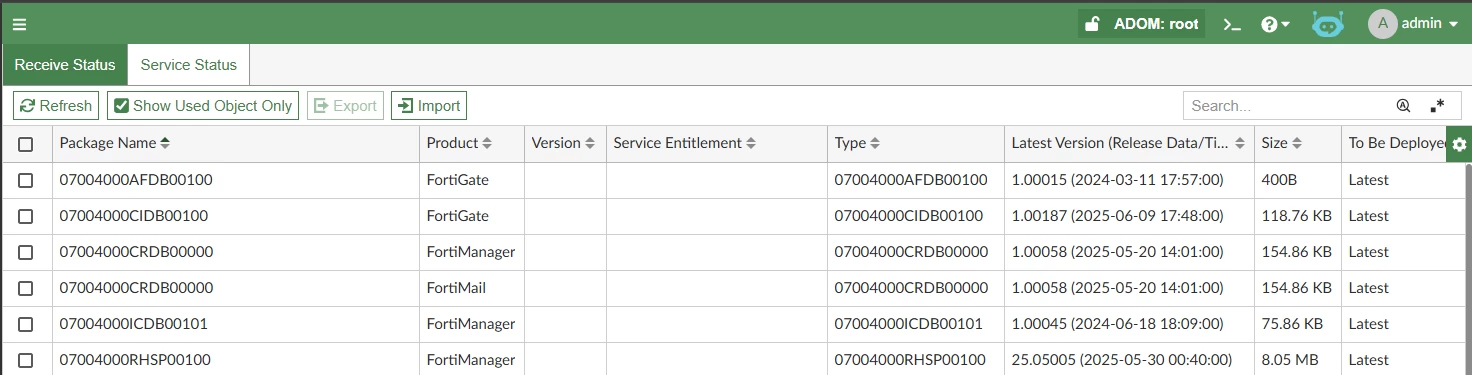
This article explains how to verify and troubleshoot FortiGuard connectivity in FortiManager, using anti-virus updates as an example.

Scope

FortiManager.

Solution

Terminology used in this document:

  • FDS = FortiGate Antivirus/IPS
  • FGD = FortiGate Web-/Email Filter
  • AV = Anti-Virus
  • IPS = Intrusion Prevention System
  • WF = Web Filtering
  • AS = Anti-Spam

    1. Ensure that FortiManager can retrieve product support coverage for the managed firewall.

    Navigate to FortiGuard → Device Licenses.

2. Ensure that FortiGuard communication is enabled in FortiManager by going to FortiGuard → Settings.

The AntiVirus and IPS services must be set to ON, and the versions for FortiGate, FortiMail, FortiSandbox, FortiClient, and FortiSwitch should be verified.

FortiProxy uses the same service structure as FortiGate.


3. Verify that service access for FortiGate Updates (FDS) or Web Filtering (FGD) is enabled on the management interface of FortiManager.

Note: This step can be skipped if the FortiGate is configured to receive updates directly from FortiGuard.

Go to System Settings → Network → Edit Port. If this option is not enabled, the managed device will not be able to receive updates.

  1. Check the FDS server list.
From the CLI, use the following command:
 
diagnose fmupdate view-serverlist fds

96.45.33.87 represents the currently active FortiGuard Distribution Server (FDS). If FortiManager cannot connect to this server, it will automatically switch to the next available server, 173.243.138.92.

To verify connectivity, use ping tests and packet capture analysis:

execute ping <current fds server>
execute ping fds1.fortinet.com
execute ping <DNS server>
diagnose fmupdate dbcontract
diagnose fmupdate vm
diagnose fmupdate test ping-server
get system status

Unlike the standard execute ping command, which only checks basic ICMP reachability, diagnose fmupdate test ping-server verifies service-level connectivity to the FortiGuard update infrastructure. It attempts a TCP connection to the FortiGuard servers, confirming that FortiManager can reach the update service at the application layer, typically over TCP port 443.

A packet capture can be run in parallel to observe the TCP connection attempt to the FortiGuard Distribution Server (FDS):

diagnose sniffer packet any "host <current fds server> and port 443"

Alternatively, to capture all traffic to and from the FDS server regardless of port:

diagnose sniffer packet any 'host <current_FDS_server>' 4 a
6. Check FDS connectivity log

Verify the FortiManager connection status using:

diagnose fmupdate view-linkd-log fds

Example output:

info fds_svrd: Start fds client session to '96.45.33.87:443'
info fds_svrd: Request sent to FDS server
info fds_svrd: Response received successfully
info fds_svrd: Check update with fds 96.45.33.87 SUCCESS

This confirms successful communication between FortiManager and the FortiGuard Distribution Server (FDS).


7. Verify antivirus package status

Go to FortiGuard → Packages and check the antivirus version and release date/time.
Compare it with the latest version available on FortiGuard to ensure updates are current.

Perform a manual update using the following command in FortiManager:

diagnose fmupdate updatenow fds
Check update status

After running the manual update, verify the result using:

diagnose fmupdate update-status fgd

Example output:

Service=fgd|Response=202|UpdatedDate=2024-04-19|UpdatedTime=03:56:28|Status=-1|UpullErr=Connect error|UpullServer=208.184.237.64
Service=fgfq|Response=202|Status=0|UpullErr=|
Service=geoip|Response=202|UpdatedDate=2024-04-10|UpdatedTime=21:23:32|Status=-1|UpullErr=Connect error|UpullServer=140.174.22.70
diagnose fmupdate update-status fds
Service=FGT|Response=202|UpdatedDate=2024-04-17|UpdatedTime=16:54:01|Status=-1|UpullStat=Disconnected|UpullErr=Connect error
8. Debug if FDS update fails

If the FortiGuard Distribution Server (FDS) update still fails, run the following debug:

diagnose debug application fdssvrd 255
diagnose debug enable

Run the debug for 2–3 minutes, then disable it:

diagnose debug disable
diagnose debug reset
Comments are closed.