IPsec VPN Troubleshooting Guide for FortiGate
Description
Master IPsec VPN Troubleshooting on FortiGate with Phase 1 and Phase 2 checks, debug commands, packet sniffers, and step-by-step tunnel issue fixes.
Scope
In this complete guide to IPsec VPN Troubleshooting, you will learn how to identify, debug, and fix IPsec VPN tunnel issues on Fortinet FortiGate devices.
This guide is designed for beginners, intermediate users, and professionals. It includes step-by-step IPsec VPN Troubleshooting, full CLI commands, and real-world scenarios.
Scope: FortiGate v7.2 and above
Solution
Identify the VPN Issue (Routing Check)
First, confirm that traffic is routed correctly.
get router info routing-table detail <destination-IP>
Explanation:
This command shows the routing path for a specific destination IP and helps with IPsec VPN Troubleshooting by verifying that traffic is using the correct route.
What it does:
- Checks if traffic is routed through VPN or WAN
- Confirms correct route selection
- Helps identify routing-related VPN failures
Check IPsec Tunnel Summary
If multiple tunnels exist, isolate the problematic one.
get vpn ipsec tunnel summary
Example Output
					'to10.174.0.182' selectors(total,up): 1/1
'to10.189.0.182' selectors(total,up): 1/0
Explanation:
Displays all active and inactive IPsec tunnels, helping with IPsec VPN Troubleshooting by providing the current tunnel status and connection details.
What it does:
- Shows tunnel status (up/down)
- Displays packet counters (rx/tx)
- Helps identify problematic tunnels quickly
Phase 1 (IKE) Troubleshooting
Phase 1 builds the secure connection between VPN peers and is a critical step in IPsec VPN Troubleshooting.
Check Phase 1 Status
diagnose vpn ike gateway list name <tunnel-name>
Example Output:
					vd: root/0
name: to10.189.0.182
version: 1
interface: port9 10
addr: 10.189.0.31:500 -> 10.189.0.182:500
created: 15s ago
IKE SA: created 1/1
IPsec SA: created 0/0

id/spi: 19576 a83334b3c66f871b/0000000000000000
direction: responder
status: connecting, state 3, started 15s ago
Explanation:
Shows Phase 1 IKE negotiation status for a specific VPN tunnel, which is important for IPsec VPN Troubleshooting.
What it does:
- Checks if Phase 1 is established
- Displays IKE SA and IPsec SA status
- Shows peer IP and interface details
⇒ If Phase 1 fails, the VPN cannot work.
Key Field: Status
- established → Phase 1 is UP
- connecting → Phase 1 is DOWN
Basic Connectivity Checks
Ensure both peers can reach each other:
execute ping <peer-IP>
Explanation:
Tests basic network connectivity to the VPN peer.
What it does:
- Confirms reachability
- Helps detect routing or firewall blocking issues
execute traceroute <peer-IP>
Explanation:
Shows the full path packets take to reach the peer.
What it does:
- Detects routing issues
- Identifies where packets are dropped
execute traceroute-options source <local-IP>
Explanation:
Forces traceroute to use a specific source IP.
What it does:
- Ensures the correct interface is tested
- Useful in multi-interface FortiGate setups
Verify IKE Ports (500 / 4500)
diagnose sniffer packet any "host <peer-IP> and (port 500 or port 4500)" 4 0 l
Explanation:
Captures IKE traffic between FortiGate and VPN peer.
What it does:
- Monitors Phase 1 negotiation packets
- Checks UDP 500 (IKE) and UDP 4500 (NAT-T)
- Confirms if packets are sent/received
Note
- Use UDP 500 → Normal IKE
- Use UDP 4500 → NAT Traversal enabled
IKE Debugging (FULL RAW)
Old Command (Pre v7.4.1)
diagnose vpn ike log filter dst-addr4 10.189.0.182
New Command (v7.4.1+)
diagnose vpn ike log filter rem-addr4 10.189.0.182
Full Debug Commands
diagnose debug reset
Explanation:
Clears all existing debug settings.
What it does:
- Resets debug filters
- Prepares system for fresh debugging
diagnose vpn ike log filter rem-addr4 10.189.0.182
Explanation:
Filters IKE debug logs for a specific remote IP.
What it does:
- Shows only relevant VPN logs
- Reduces noise during troubleshooting
diagnose debug application ike -1
Explanation:
Enables detailed IKE protocol debugging.
What it does:
- Logs Phase 1 negotiation steps
- Shows authentication and encryption issues
diagnose debug console timestamp enable
Explanation:
Adds timestamps to debug output.
What it does:
- Helps correlate logs with packet captures
- Useful for time-based troubleshooting
diagnose debug enable
Explanation:
Activates debug mode.
What it does:
- Starts real-time logging
- Captures VPN negotiation flow
Stop Debug
diagnose debug disable
Explanation:
Stops debug output.
What it does:
- Stops log generation
- Prevents performance impact
Important Version Changes (v7.4+)
dst-addr4➜ replaced withrem-addr4src-addr4➜ replaced withloc-addr4
⇒ Always use correct commands based on FortiOS version.
View All Debug Filter Options
diagnose vpn ike log filter ?
Output:
					list
clear
vd
name
ifindex
loc-addr4
mloc-addr4
rem-addr4
mrem-addr4
loc-addr6
mloc-addr6
rem-addr6
mrem-addr6
dst-port
negate
Common Filters
name→ filter by tunnel namerem-addr4→ remote IPloc-addr4→ local IPmrem-addr4→ multiple remote IPsifindex→ interface
Explanation:
Shows all available filtering options.
What it does:
- Displays supported filter types
- Helps build precise debug filters
⇒ Useful when peer IP is unknown.
Clear Debug Filters (Best Practice)
diagnose vpn ike log filter clear
Explanation:
Removes all active IKE debug filters.
What it does:
- Resets filtering system
- Prevents incorrect debug filtering
⇒ Always clear filters before starting new debug.
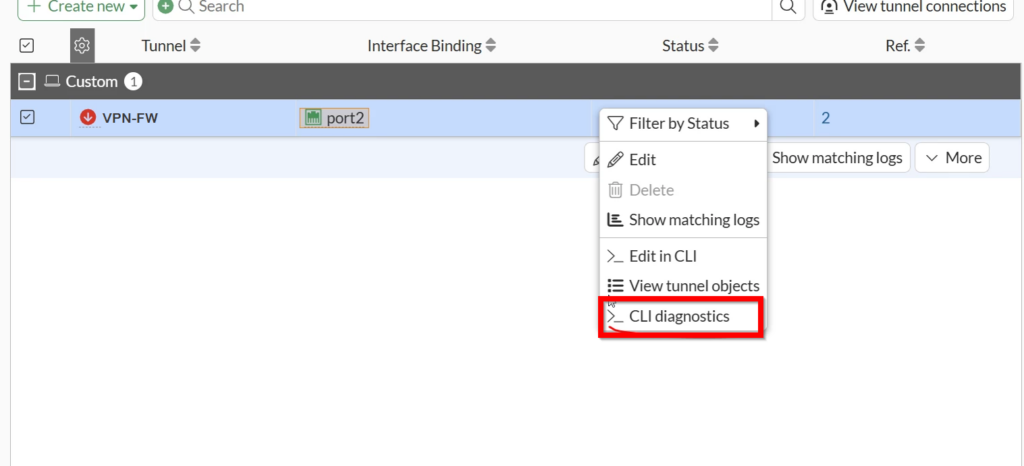
GUI Debug Option (v7.6.3+)
You can run IKE debugging from GUI using:
- CLI Diagnostics tool
⇒ This simplifies troubleshooting without CLI.
Authentication Debug Commands
FNBAM (User Auth)
diagnose debug application fnbamd -1
Explanation:
Debugs user authentication process.
What it does:
- Checks username/password authentication
- Used for VPN user login issues
SAML / EAP Authentication Debug
					diagnose debug application samld -1
diagnose debug application eap_proxy -1
Explanation:
Debugs SAML and EAP authentication services.
What it does:
- Identifies login failures
- Helps with enterprise authentication issues
Phase 2 Troubleshooting
If Phase 1 is working, check Phase 2 (IPsec SA).
Check Tunnel Details
diagnose vpn tunnel list name <phase1-name>
Example Output (RAW):
					name=to10.189.0.182 ver=1 serial=2 10.189.0.31:0->10.189.0.182:0
bound_if=10 lgwy=static/1 tun=intf/0 mode=auto/1 encap=none/8 options[0008]=npu
proxyid_num=1 child_num=0 refcnt=10 ilast=25 olast=25 ad=/0
stat: rxp=0 txp=0 rxb=0 txb=0
dpd: mode=on-demand on=0 idle=20000ms retry=3 count=0 seqno=534
natt: mode=none draft=0 interval=0 remote_port=0
proxyid=to10.189.0.182 proto=0 sa=0 ref=1 serial=4
src: 0:172.16.170.0/255.255.255.0:0
dst: 0:192.168.50.0/255.255.255.0:0
Explanation:
Shows IPsec Phase 2 SA details.
What it does:
- Displays encryption status
- Shows traffic selectors
- Shows SA (Security Association) state
Key Field: SA Status
- sa=0 → mismatch or no traffic
- sa=1 → working
- sa=2 → rekey process
Verify Selectors
get vpn ipsec tunnel details
Check:
- Source subnet
- Destination subnet
- Encryption settings
Encryption Mismatch
If Phase 2 fails:
- Check encryption (AES, SHA)
- Check lifetime values
- Check PFS settings
⇒ Use IKE debug to confirm mismatch.
Dial-up VPN Troubleshooting
diagnose vpn tunnel dialup-list <phase1-name>
Explanation:
Lists all active dial-up VPN connections.
What it does:
- Shows multiple remote clients
- Useful for hub-and-spoke VPN setups
Packet Capture & Time Sync
Enable Timestamp Sync
diagnose debug console time enable
Explanation:
Enables synchronized timestamps in logs.
What it does:
- Aligns debug logs with packet capture
- Improves troubleshooting accuracy
Run Packet Sniffer
diagnose sniffer packet any "host <peer-IP> and icmp" 4 0 l
⇒ Helps confirm traffic flow through tunnel.
Real Troubleshooting Scenario (Important)
Problem:
- Tunnel interface is green (UP)
- Tunnel is inactive
- No traffic passing

Sniffer Result:
					diagnose sniffer packet any 'host 10.1.1.37 and icmp' 4 0 l

2024-07-16 10:46:01 internal in 192.168.1.251 -> 10.1.1.37: icmp: echo request
2024-07-16 10:46:02 internal in 192.168.1.251 -> 10.1.1.37: icmp: echo request
Debug Flow:
- No drops detected
- Route exists
					iprope_dnat_check line=5191 msg="in-[internal], out-[]"
iprope_dnat_check line=5204 msg="result: ret-no-match, act-accept"
vf_ip_route_input_common line=2615 msg="find a route: gw-10.1.1.37"
Tunnel Output Analysis:
					name=Primary Tunnel ver=1 serial=2 10.101.1.1:0->10.101.1.2:0
run_state=0
stat: rxp=11746 txp=32 rxb=1939048 txb=9861

proxyid=Net-10.1.1.0-24 proto=0 sa=1

SA:
mtu=1438 expire=42832 replaywin=2048

enc: spi=533e1c0c esp=aes key=16
dec: spi=e6bb099b esp=aes key=16

dec:pkts=476 enc:pkts=0
Analysis
- enc increasing → traffic sent
- dec not increasing → no return traffic
- run_state=0 → inactive
⇒ Issue: Remote side or routing problem
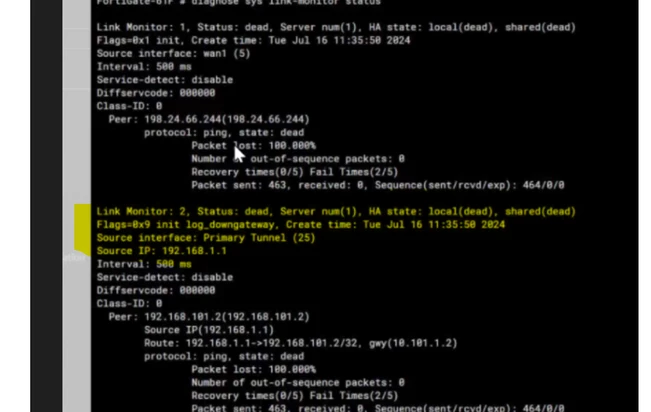
Link Monitor Issue
Sometimes tunnel is down due to health check.
⇒ Disable link monitor temporarily:
- Check if tunnel becomes active
NPU Offloading Issue
NPU may hide traffic during debugging.
Check NPU
					config vpn ipsec phase1-interface
edit <tunnel>
show full | grep npu
Explanation:
Checks if hardware acceleration is enabled.
What it does:
- Shows if traffic bypasses CPU debug
- Important for troubleshooting visibility
Disable NPU
set npu-offload disable
Explanation:
Disables hardware acceleration for VPN.
What it does:
- Forces traffic through CPU
- Allows full packet visibility in debug
Unknown SPI Issue (Critical)
Problem:
- Logs show Unknown SPI
Cause:
- SA mismatch
- Device reboot
- Network issue
Fix:
diagnose vpn tunnel flush name <tunnel-name>
Explanation:
Fixes SPI mismatch issues.
What it does:
- Clears invalid Security Associations
- Forces new encryption keys negotiation
Useful Advanced Commands
diagnose vpn ike status detailed
Explanation:
Shows full IKE system status.
What it does:
- Displays all active VPN negotiations
- Helps deep-level VPN analysis
Flush Commands:
diagnose vpn tunnel flush <name>
Explanation:
Forces VPN tunnel reset.
What it does:
- Clears current SA (Security Association)
- Forces renegotiation of VPN tunnel
diagnose vpn ike gateway clear name <name>
Explanation:
Removes current IKE session.
What it does:
- Forces Phase 1 restart
- Useful for stuck VPN sessions
diagnose vpn ike gateway flush name <name>
Explanation:
Clears all IKE SAs for a tunnel.
What it does:
- Resets all Phase 1 sessions
- Forces fresh VPN negotiation
Custom IKE Port (Advanced)
If ports are blocked:
- Configure custom IKE port
- Use TCP for IKE/IPsec
⇒ Useful in restricted networks.
Note / Best Practices
- Match Phase 1 and Phase 2 on both sides
- Enable Dead Peer Detection (DPD)
- Always check routing first
- Disable NPU during troubleshooting
- Clear debug filters before use
- Verify enc/dec counters regularly
FAQ
Why is my IPsec VPN stuck in connecting state?
Phase 1 is failing due to IKE mismatch or blocked ports.
What does SA=0 mean in FortiGate VPN?
It means selectors mismatch or no traffic is initiated.
Why VPN is UP but no traffic passing?
Check routing, policies, or remote-side configuration.
What is Unknown SPI error in VPN?
It indicates SA mismatch or sync issue between peers.
How do I verify VPN traffic flow?
Check enc/dec counters in tunnel output.
Why disable NPU offload?
It allows accurate debugging and packet visibility.